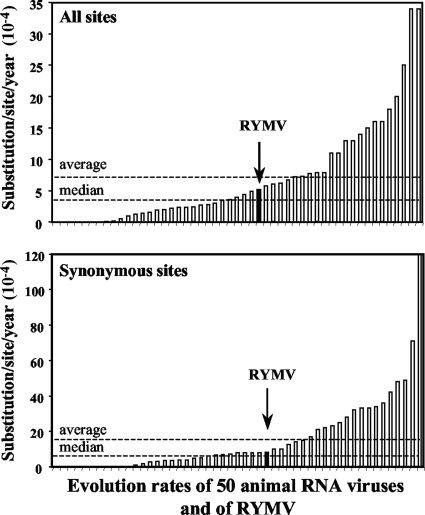
FIG. 2.
Overall (top) and synonymous (bottom) evolution rates of a range of 50 RNA animal viruses (Jenkins et al., 2002 [26]) and of the RYMV CP gene (solid bars and arrows). Horizontal dashed lines indicate the median and average evolution rates of the 50 RNA animal viruses.

