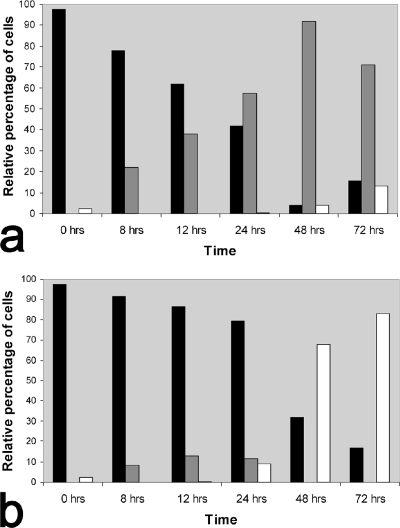
FIG. 3.
Distribution of trophozoites, immature precysts, and mature cysts during the course of encystment in the presence (a) or absence (b) of glycogen phosphorylase siRNA. The cell distribution (percentages of different cell types at different time points after the induction of encystation) was determined by counting cells viewed under an inverse microscope. The minimum number of cells counted per time point was 130; the maximum number of cells counted per time point was 600. All experiments were repeated five times. Black columns, trophozoites; gray columns, immature precysts; white columns, mature cysts.

