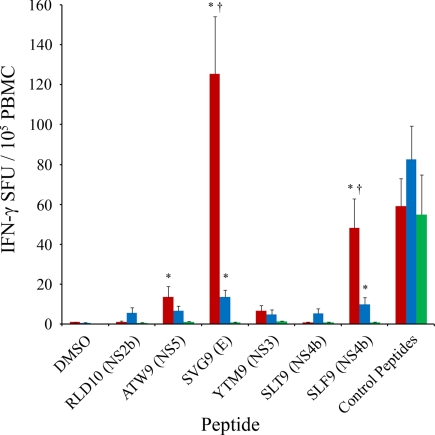
Fig. 3.
CTL reactivity of identified WNV epitopes. Shown are IFN-γ ELISPOT assays with WNV peptides and PBMC isolated early (red) and late (blue) after infection from WNV-positive individuals and healthy controls (green). *, significant increase from healthy controls; †, significant increase from the late set (blue). Significance was determined by Kruskal–Wallis one-way ANOVA followed by Dunn's method; P < 0.05.

