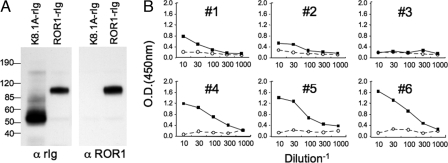
Fig. 2.
Anti-ROR1 antibody detected by ELISA. (A) Immunoblots of ROR1-rIg or control K8.1A-rig that subsequently were probed with goat anti-rabbit Ig (α rig) (Left) or goat anti-ROR1 Ig (α ROR1) (Right). The lanes containing the K8.1A-rig or ROR1-rig are indicated. The isolated proteins were assessed for purity by using GelCode blue stain reagent (Pierce) staining after the SDS/PAGE. The numbers indicate the molecular sizes of marker proteins run in parallel lanes of the SDS/PAGE. (B) ELISA for anti-ROR1 antibodies in sera from each patient. The open circles connected with dashed lines indicate the data with pretreatment sera, and the closed squares connected by lines indicate the data of posttreatment sera. The optical density (at 450 nm) is indicated for the serum samples at each of various dilutions (as indicated by the inverse of the dilution factor on the x axis).

