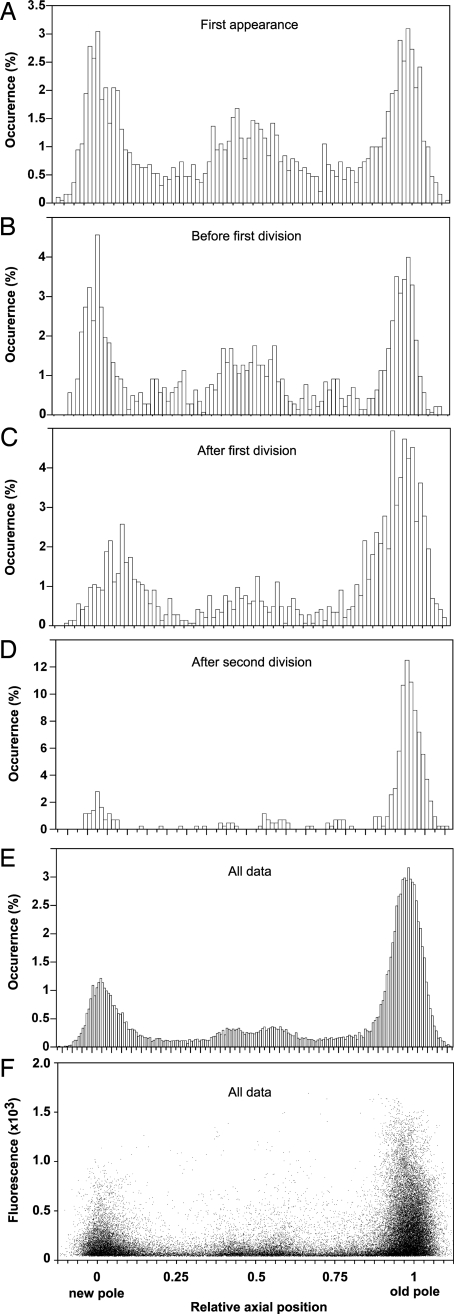
Fig. 2.
Aggregate distribution and associated fluorescence levels along the cell axis. Shown is IbpA-YFP foci localization along the cells' normalized longitude internal coordinate, oriented from the new pole (0) to the old pole (1) of each cell. Binned histograms show foci localization (A–D, 100 bins; E, 200 bins) at first appearance (A), at the last movie frame before first division (B), at the first movie frame after first division (C), at the first movie frame after two consecutive divisions (D), and cumulative over all movies' frames (E). (F) Foci maximal fluorescence intensity (arbitrary gray-level units) as a function of their localization.

