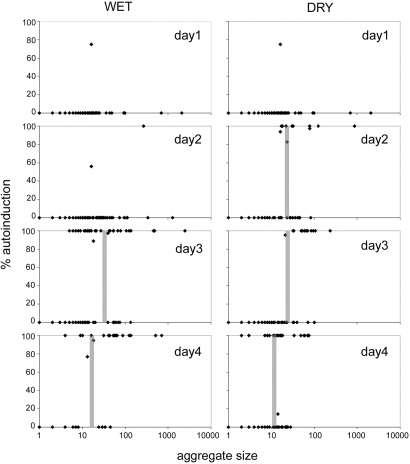
Fig. 2.
QS induction observed in Pss (pIRed) inoculated on bean leaves occurs with increasing time and is affected by water availability. Each symbol represents a given cell aggregate observed by fluorescence microscopy on plants incubated only under wet conditions (Left) or under dry conditions after the first 24 h (Right). The vertical bars represent the QS induction point, that cell aggregate size at which the proportion of red fluorescent (QS-induced) cell aggregates and nonfluorescent aggregates are similar.

