
Figure 2.
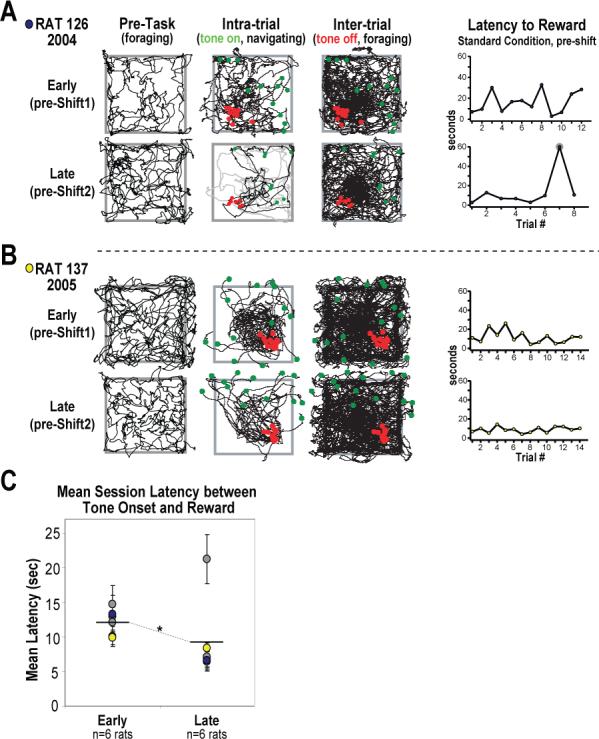
Behavior from two rats at two time points during the acquisition of the place preference task (at “early” and “late” phases of learning), and grouped data showing significant improvement in task performance (as measured by response latency). A,B Behavioral plots and trial response latencies for two rats from each of the groups trained in the task. Behavior is given for both the early (top row) and late (bottom row) phases of acquisition for epochs of pre-task foraging (left), and for concatenated periods of presumed navigation (“tone-on”, center) and inter-trial foraging (“tone-off”, right). Green and red dots represent a rat's location at the onset and offset of the tone, respectively. Note that early in acquisition both rats were inaccurate in locating the goal, often erring toward the center of the platform and having to make persistent corrective behaviors before finding the unmarked goal which triggered reward (top center plots). Late in acquisition rats were able to more accurately find the goal with less corrective behavior (bottom center plots) and shorter response latencies (line graphs, far right). Note that most rats would fail to respond in 1 of every 7−10 trials even late in acquisition, yielding longer response latencies on that trial (A, highlighted in gray on line graph, with behavior on that trial also in gray). The rat shown in B rarely failed to respond to tone-initiated trials. C Grouped data showing significant task improvement as measured by average response latencies. The improvement shown by the rat given in A is a typical example (denoted by blue markers). Note that the rat given in B (yellow dots) displayed the least improved response latencies, yet the improvement in behavior was notable (compare upper and lower navigating behavior plots). *p < .05.