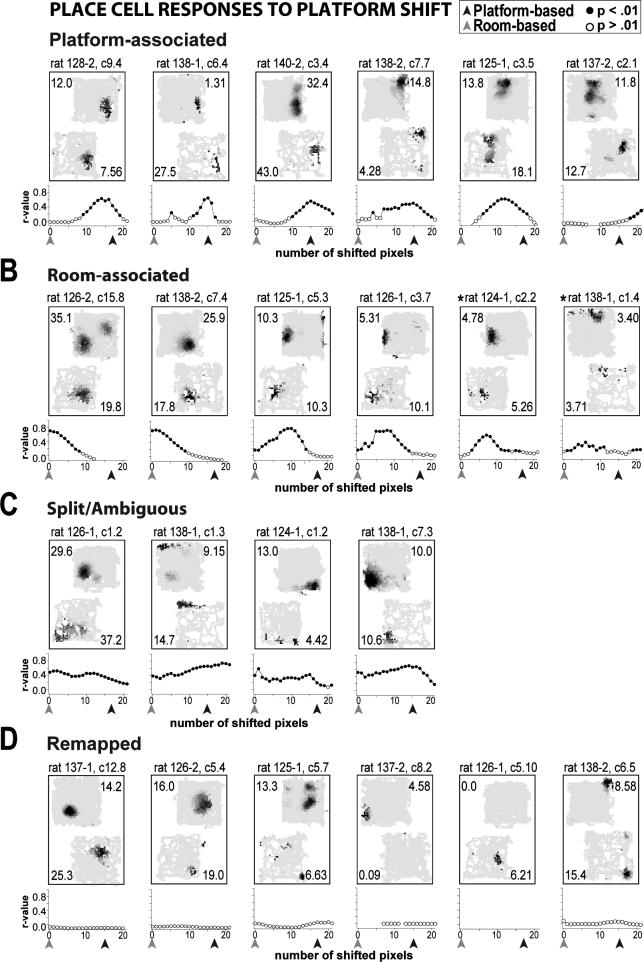
Figure. 4.
Representative task-associated rate maps for categories of place cell responses to the platform-shift manipulation. Note that the observed r-values for each pixel-shift correlation (calculated at each step as the maps were aligned in 1 pixel increments) are plotted for each cell (filled black dots: p < .01, open dots: p > .01). A,B Cells with significant correlations observed at pixel-shifts corresponding to either the platform- (black arrows) or room- (gray arrows) based coordinate frame were defined as displaying platform- or room-associated activity, respectively. Additionally, cells displaying activity in between the two coordinate frames (>2 consecutive significant r-values) were categorized according to the reference frame to which the activity was more strongly bound (e.g., asterisks). A majority of cells displayed activity that was more strongly bound to the platform- than to the room-based coordinate frame (see text). C Cells with significant r-values at both coordinate frames were considered ambiguous. D Cells for which fewer than 3 consecutive significant r-values were observed in the shifting correlation analysis were defined as having remapped. Although sometimes a change in the location of place-specific activity between the standard and platform-shifted condition was observed (e.g., first two rate maps), most remapping was the result of a lack of place-specific firing in one condition (∼80%). Rate map scaling and cell identification conventions are described in Figure 3 caption.

