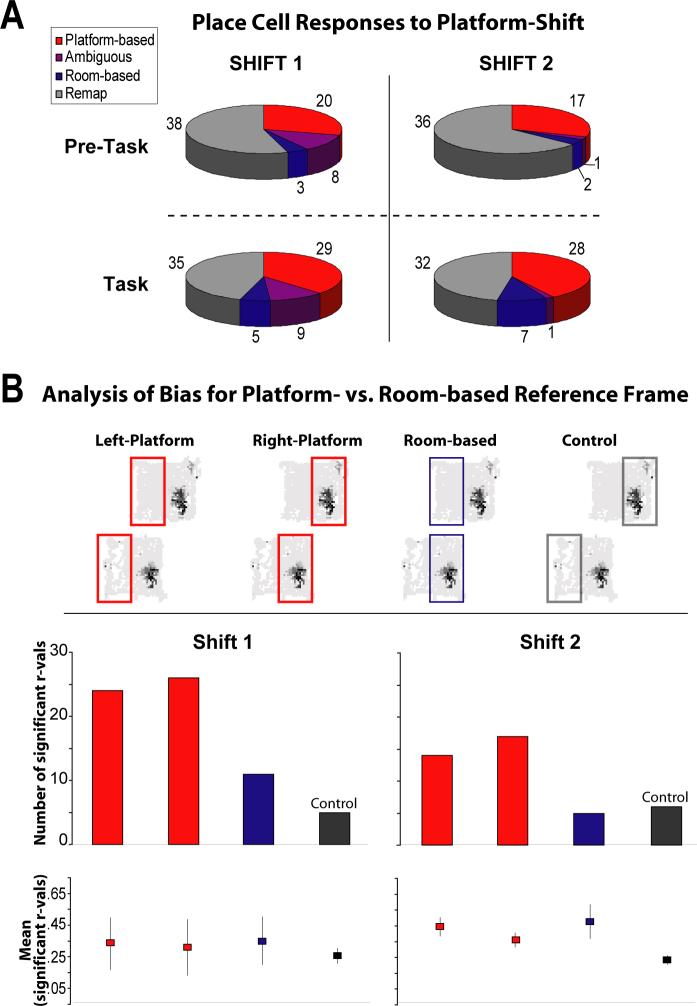
Figure 5.
Proportions of place cells observed in each response category for platform-shift manipulations at the early (Shift 1) and late (Shift 2) phases of task acquisition, and the results of a control analysis used to investigate the apparent bias in the prevalence of platform-associated activity relative to room-associated activity. Note that rate maps from pre-task foraging were analyzed separately from task-associated rate maps. A Pie graphs showing the proportions of cells falling into each category during pre-task and task epochs for Shift 1 and Shift 2 (the raw numbers of cells observed in each category are given). Note the decrease in the number of cells displaying ambiguous activity between Shift 1 and Shift 2. The difference between Shift 1 and Shift 2 (collapsed across pre-task and task epochs) was significant (X2 = 10.37, p = .02), but the difference between pre-task and task (collapsed across Shift 1 and Shift 2) failed to reach significance (X2 = 5.95, p = .11). Chi-square comparisons between pairs of individual pie graphs could not be performed due to the low number of cells categorized as room-associated or ambiguous in the pre-task epochs, resulting in expected values that were below 5.0 for tabulated categories. B Rate map comparisons that controlled for the amount of sampled space were made to determine if the apparent bias toward platform-associated activity reflected a real bias in the way hippocampal cells coded for momentary position in the platform-shifted condition. A similar number of significant correlations were observed for left and right half-platform comparisons (compare red bars within histograms), indicating that place fields were homogeneously distributed across the platform. Fewer significant room-based correlations were observed relative to platform-based comparisons, suggesting a bias in the way cells responded to the shifted platform (compare blue bars to the red bars within each histogram). Significant room-based correlations occurred more frequently than predicted from the control comparisons for Shift 1, but were observed at chance levels for Shift 2 (compare blue bar to black bar within histograms). However, room-based comparisons for Shift 2 yielded significantly higher r-values than controls (bottom graph, see text), indicating that room-based activity was significantly more similar to standard conditions than expected based on chance correlations.

