


Figure 7.
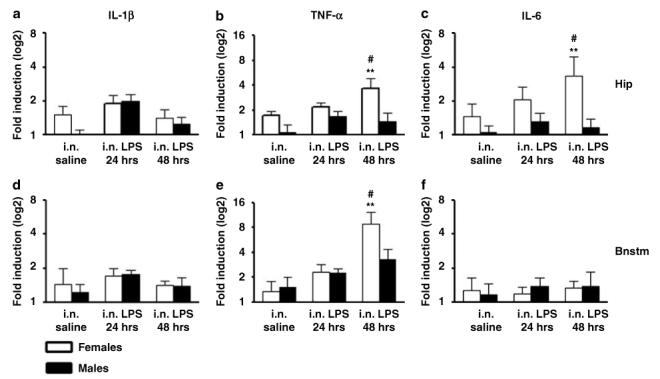
Relative mRNA cytokine expression in the hippocampus and brainstem of female and male F344/NHsd rats in control saline conditions (n = 12), 24 h after a single intranasal (i.n.) administration of LPS (100 μg/rat) (n = 12) or after two instillations of LPS (100 μg/rat each day) in 2 consecutive days (n = 12). The determinations for IL-1β (a, d), TNF-α (b, e), and IL-6 (c, f) were done by triplicates obtained from the same cDNA preparation for each individual brain region. Values are means±SEM. Values are fold induction with respect to control saline displayed in a logarithmic scale. Hip: hippocampus; Bnstm: brainstem. **Significant differences with respect to control p<0.01. #Significant sex-difference, p<0.05.