
Figure 5.
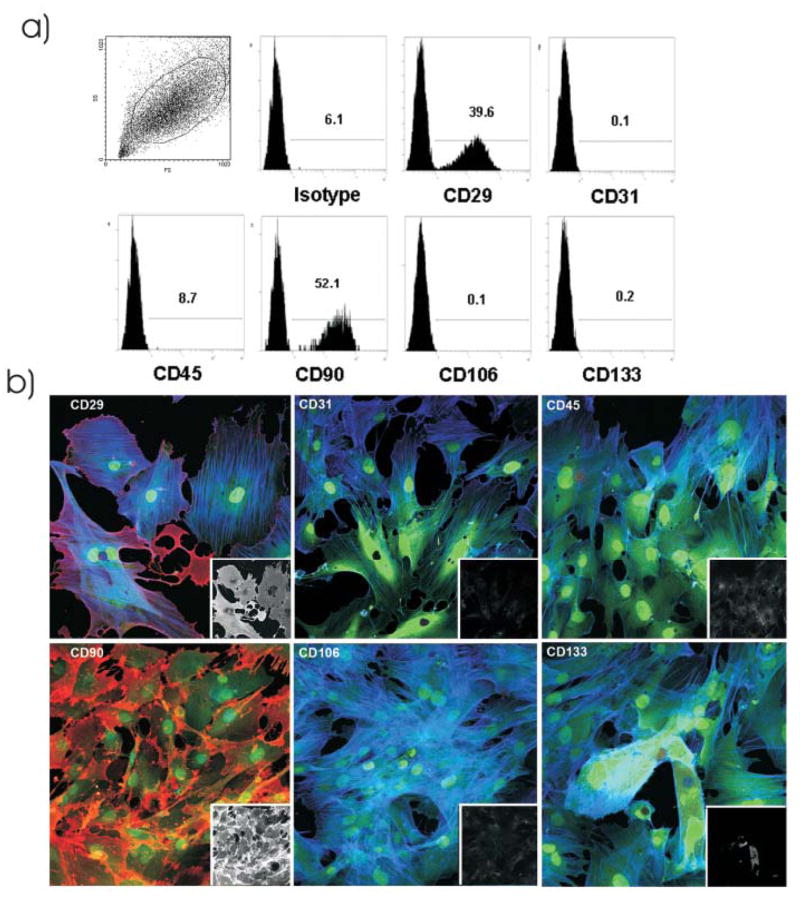
Surface markers expression of cultured, passage three ASCs from naïve GFP+ rats. a) Representative plots of ASCs obtained by culturing the subcutaneous and abdominal fat tissues obtained from naïve animals. Flow cytometric analysis showed that cultured ASCs expressed CD29 and CD90. b) Cells expressed CD29 and CD90 (red) in vitro, while the majority of these cells were negative for CD31, CD45, CD106 and CD133. Blue is F-actin stain and green is endogenous GFP signal. Inserts are the black and white rendition of the red channel for each of these markers.