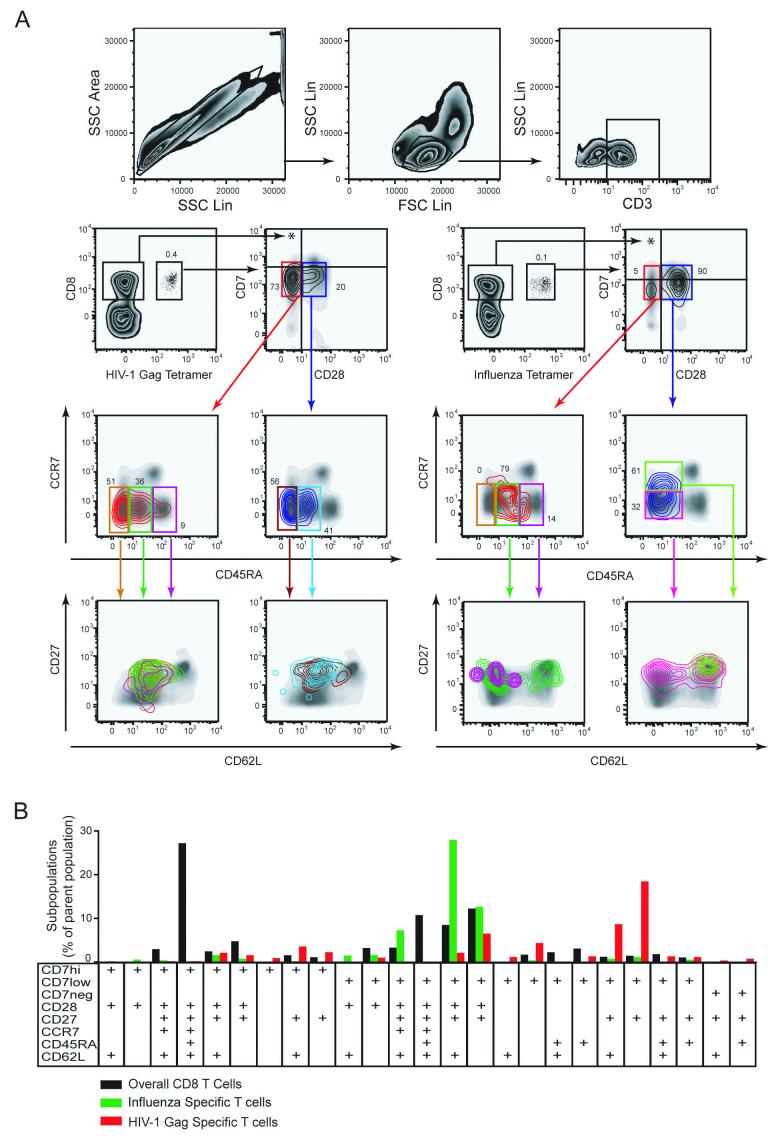
Fig. 1.
High definition phenotypic analysis of virus-specific CD8 T cells. A) T cells were identified by gating on single cells, using SSC-Area versus SSC-Height (upper left panel), followed by gating on lymphocytes (upper middle panel), and CD3+ cells (upper right panel). The lower left panels display identification and subset analysis of CD8 T cells specific for the HIV-1 Gag 77-85 epitope. The lower right panels display identification and subset analysis of CD8 T cells specific for Influenza virus M1 58-66 epitope. Tetramer-defined cells are displayed as a contour plot overlay on a background density plot that represents all CD3+ lymphocytes included as a reference. In subset analysis the contour plot color follows the gate color upstream in the gating scheme. B) Subset distribution analysis of T cells specific for Influenza virus (green) and HIV-1 Gag (red) in comparison with the overall CD8 T cells from the healthy donor in A). Bars represent occurrence of a particular subset as percentage of the parent populations. Anti-CD3 mAb was conjugated with CasY, HLA-A2 tetramer with APC, and anti-CD8 mAb with PerCp. Subsets were defined by expression of CD7 (PE), CD28 (FITC), CD27 (APC-Cy7), CCR7 (PE-Cy7), CD45RA (PacB), and CD62L (PE-TR) as indicated in the figure. Only the 25 subsets which represented at least 1% of total CD8 T cells or at least 0.2% of tetramer-defined T cells were included in the analysis.

