
Figure 2.
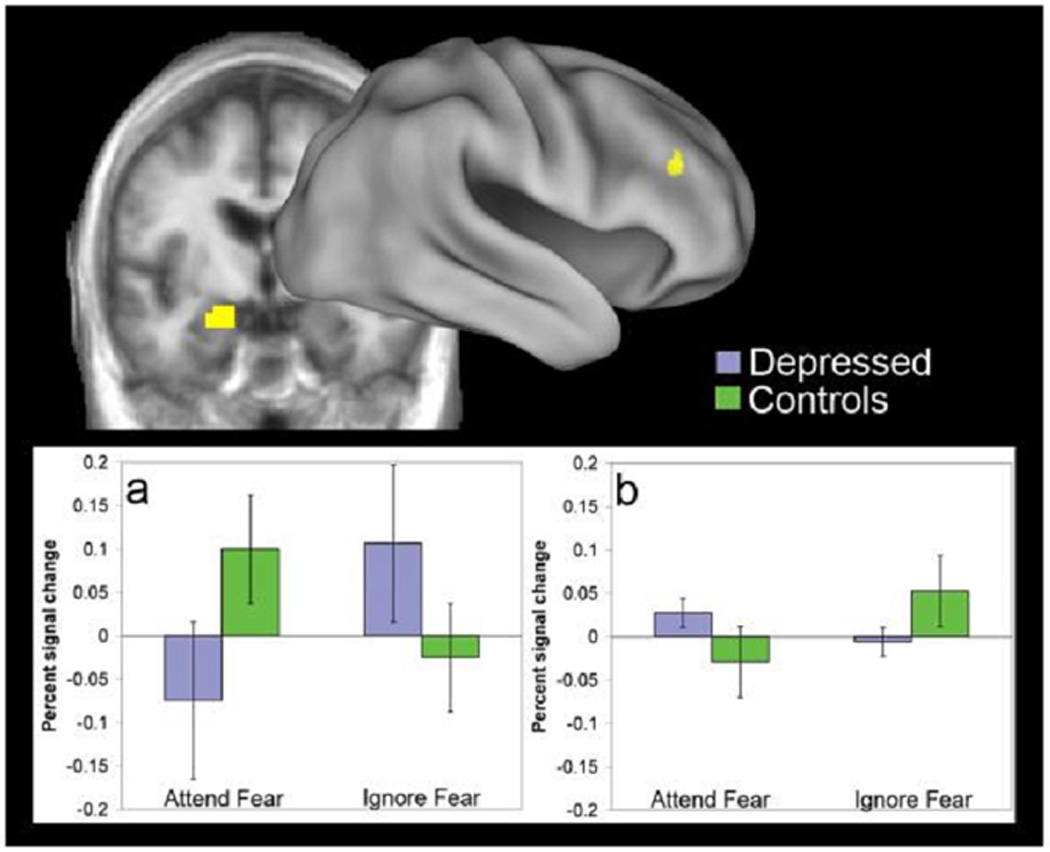
Areas in the left amygdala (a) and right dorsolateral prefrontal cortex (b) showing a significant three-way interaction of attention × emotion × group. Graphs show percent change in signal magnitude for the fear-minus-neutral contrast in each region. Error bars show standard errors of the mean.