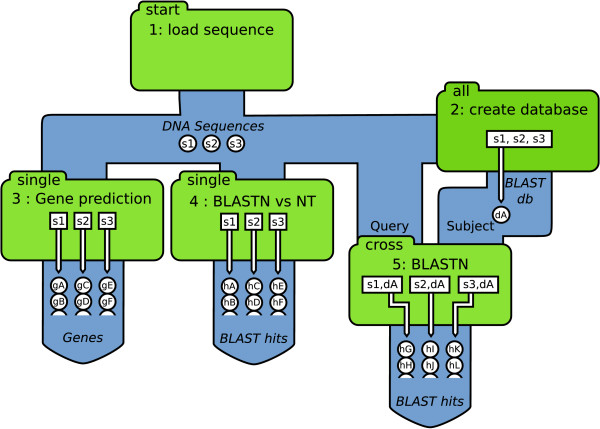
Figure 4.
Data flow within Cyrille2. Detailed illustration of the data flow and scheduling strategies of the node types from the pipeline shown in Figure 1. Green boxes represent nodes. The different node types start, single, all, and cross are indicated in the top left corner of each box. In this example, three DNA sequences are uploaded into the system (s1, s2 and s3) which are subsequently processed by the different nodes. Open circles in-between the nodes indicate objects traversing the pipeline. Open boxes inside the nodes represent the jobs that are scheduled. For example; sequences uploaded (s1, s2 and s3) are scheduled by node 4 for a BLASTN analysis against the NT database. This BLAST analysis results in the BLAST-hits indicated by objects hA-hF. See text for more details.

