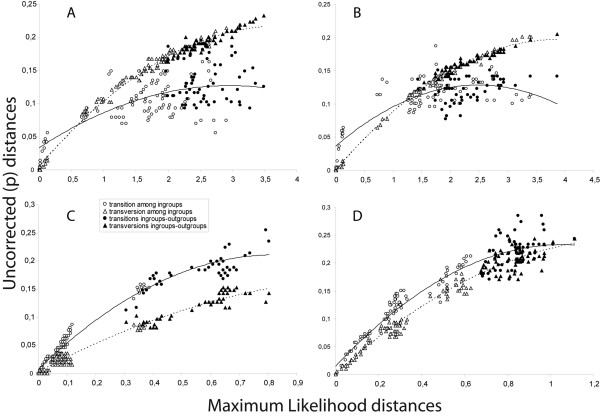
Figure 3.
Saturation on third codon positions. Comparison between ML distance (X axis) and uncorrected distances for third codon positions (Y axis) estimated from: a) CoI, b) CoII, c) cac, and d) sc sequences. Transitions and transversions distances within ingroup and between ingroup-outgroup are labeled. Dotted lines correspond to regression lines fitted to transitions and solid lines for transversions.

