
Figure 9.
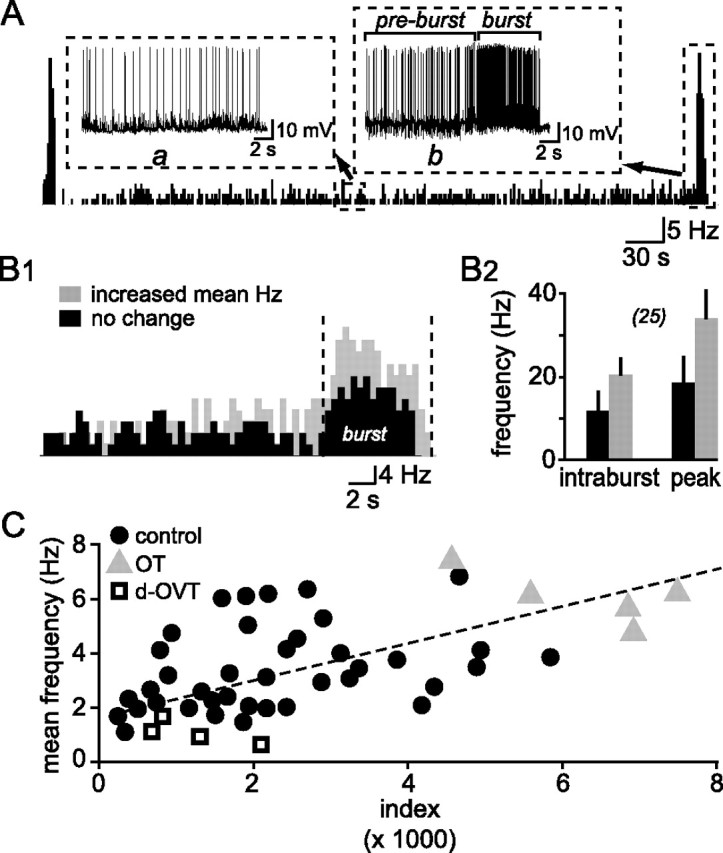
Preburst firing and burst magnitude in OT neurons. A, Frequency histogram (FH) illustrating the bursting activity of an OT neuron recorded in cultured slices. Insets show the raw recording at the time indicated before and during a burst. B1, Superimposition of FHs recorded from two OT neurons displaying (gray) or not (black) an increased firing activity before the occurrence of a burst. Burst magnitude was larger in the neuron showing such an increase. B2, Summary histogram illustrating the mean intraburst frequency and the mean peak frequency in neurons showing (gray; n = 25) or not showing (black; n = 25) an increased firing rate before burst occurrence. C, Correlation between burst magnitude (index) and firing rate before the burst (mean frequency). Data were obtained from control experiments (black dots; n = 39), with 50–100 nm OT (gray triangles; n = 5) and 100 nm d-OVT (empty squares; n = 4). The dotted line represents the linear regression through the data points obtained under control conditions (r = 0.61).