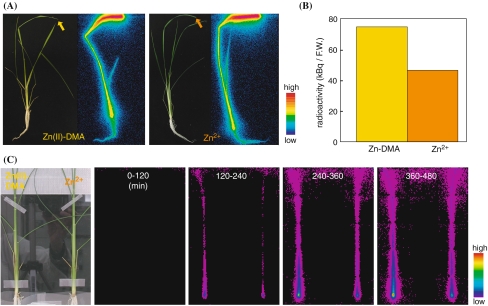
Fig. 6.
62Zn movement from cut leaf in Zn-deficient rice using PETIS (a) Plant image (left) and BAS image (right). Arrows indicate the point where 62Zn was absorbed. (b) Radioactivity in the entire plant except for the second newest leaf after 8 h of absorption. (c) Time course of the accumulation of radioactivity as determined by PETIS analysis. The data were scored every 3 min, and the images shown were taken at 120-min intervals for 8 h after supplying 62Zn through the shoots

