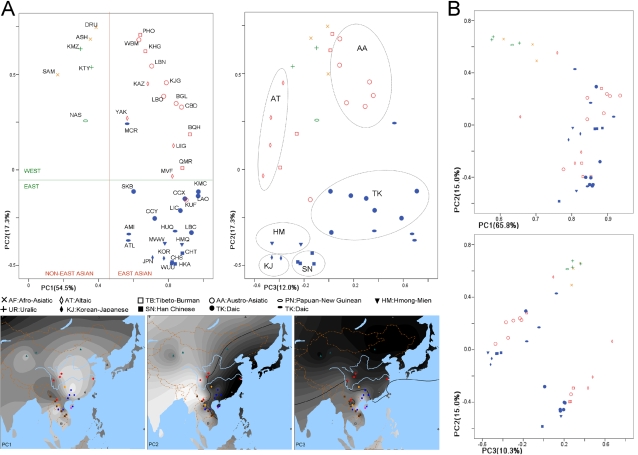
Figure 4. Principal Component Analysis plots.
Notes: The plots show the relationships among populations estimated by PCA. Plots in part A were based on the ADH1B haplotypes frequency data in Figure 3. Plots in part B used the haplotype frequency data of the whole ADH region in Figure 2. In part A, an ethnic related distribution is obvious, while in part B the distribution shows no strong distinct clusters corresponding to ethnicity.

