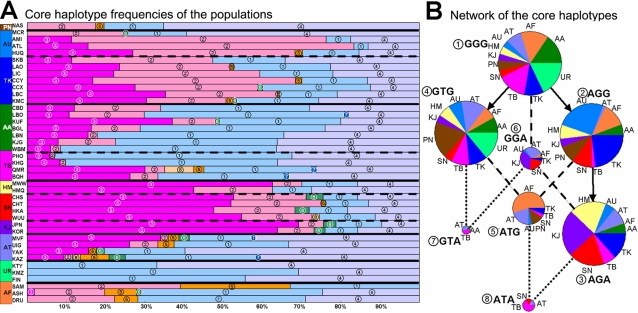
Figure 5. Frequencies and network of the core haplotypes (rs1229984-rs6810842-rs3811801).
Notes: Haplotype codes (1) to (8) are in the same system for both part A and part B of the figure. The sizes of the balls in the network of part B represent the rough relative frequencies of the haplotypes. The arrows are the most likely mutational relationships. The broken lines indicate possible historical recombinations. Haplotype (3) is more derived and presumably younger than haplotypes (1), (2), (4), and (6). Its high frequency in some populations suggests selection may have operated.

