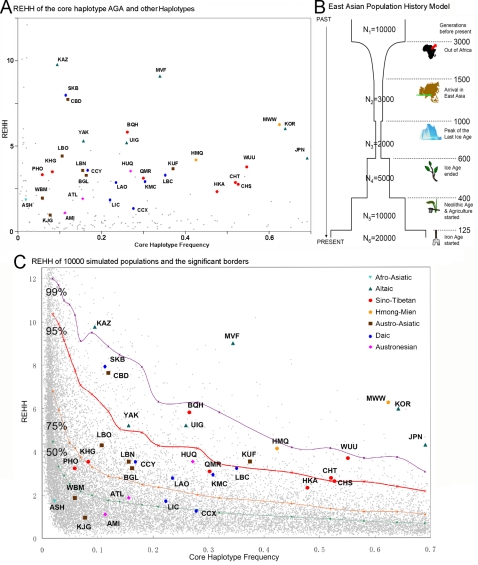
Figure 7. REHH of observed and simulated populations.
Note: The colored dots are observed REHH data of core haplotype AGA both in chart A and C. In chart A, the observed REHH data shows that most of the REHH values of haplotype AGA are higher than those of the other haplotypes. Part B is the East Asian population history model determined by complicated factors. Six phases were defined with the effective population numbers and the generation numbers to present. Chart C indicates the REHH data simulated by the model in part B along with the data in Chart A. The lines in chart C are comparison borders of the simulated data. The observed REHH of haplotype AGA of all the Altaic and Hmong populations are above the 95% border, which is the evidence of positive selection.

