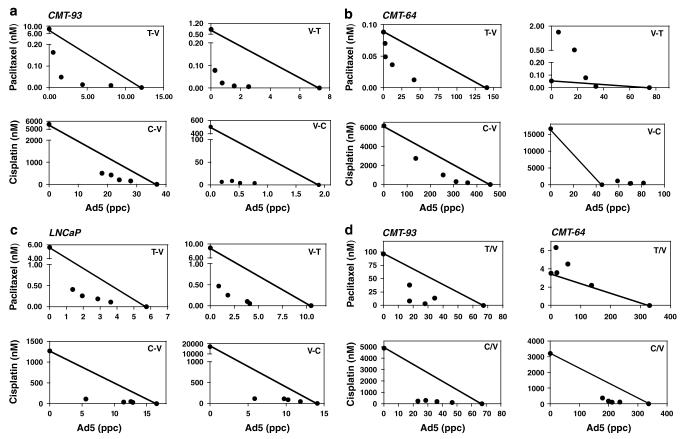
Figure 1.
Representative isobolograms from combination treatment of wild-type virus and paclitaxel or cisplatin in murine and human cell lines. (a–c) Cells were infected with virus either 24 h prior to (V–T), (V–C) or 24 h after (T–V), (C–V) addition of paclitaxel (T) or cisplatin (C) at predetermined concentration ratios as in Materials and methods, (a) CMT-93, (b) CMT-64, (c) LNCaP. (d) Paclitaxel and cisplatin were added simultaneously with virus to the CMT-93 and CMT-64 cells. EC50 values for each combination ratio were determined from dose–response curves and represented in isobolograms. The straight line connects the EC50 values for each agent alone and illustrates the theoretical values resulting in additive effects. Data points below the line represent synergistic (CI≤0.8) and above the line antagonistic (CI≥1.2) interactions. Data are from one representative experiment in triplicate.

