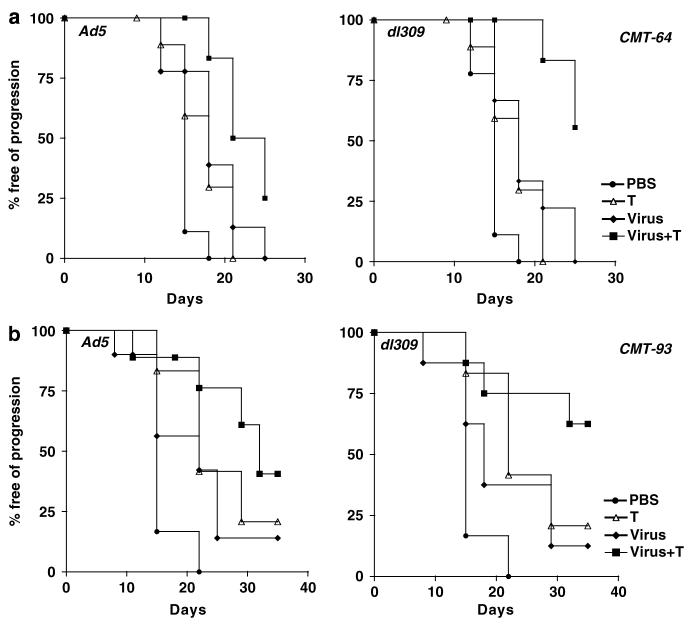
Figure 4.
Tumor progression analysis for combination therapies with paclitaxel. Kaplan–Meier curves for treatment groups in C57Bl/6 with intact immune system. (a) Animals with CMT-64 tumors were treated with Ad5 (1 × 10¹⁰ vp) (filled diamonds, (a) left), dl309 (1 × 10¹⁰ vp) (filled diamonds, (a) right), paclitaxel (T; open triangles), combination treatments (filled squares) and PBS (filled circles). Combinations of Ad5 or dl309 with paclitaxel were significantly different from single agent treatments with P<0.05. (b) Animals with CMT-93 tumors were treated with Ad5 or dl309 (filled diamonds), paclitaxel (T; open triangles), virus with paclitaxel (filled squares). Combinations of dl309 with paclitaxel were significantly different from single agent treatments with P<0.05. The percentage of mice free from tumor progression (tumor volume <500 μl) at each time point was estimated using the Kaplan–Meier method, 10 animals per group.

