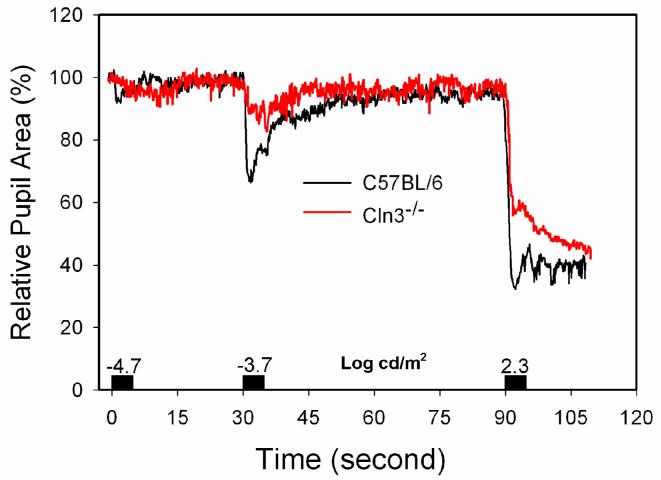
Fig. 9.
Averaged PLR vs. time curves from 24-month-old Cln3-/- (n=4) and from age-matched wild-type (n=5) mice. Black blocks over the time axis represent the duration of light stimulation and the numbers indicate the stimulus intensities (log cd/m2). The Cln3-/- mice exhibited decreased and sluggish PLRs.

