
FIG. 1.
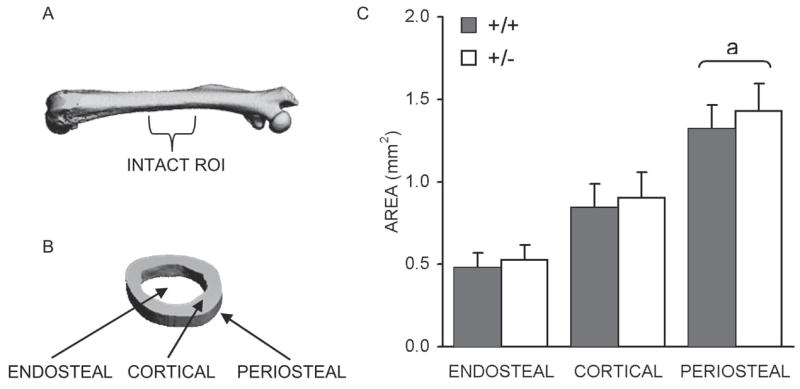
Intact femoral μCT analysis. (A) μCT image of intact femur with approximate ROI used for areal analysis labeled. (B) Section of analyzed ROI with endosteal, cortical, and periosteal regions labeled. (C) Bar graph showing average endosteal, cortical, and periosteal area cross-sectional areas ± SD (mm2), as determined for HIF-1α+/+ and HIF-1α+/− mice. ap < 0.03, significant difference between genotypes (Mann Whitney).