
FIG. 3.
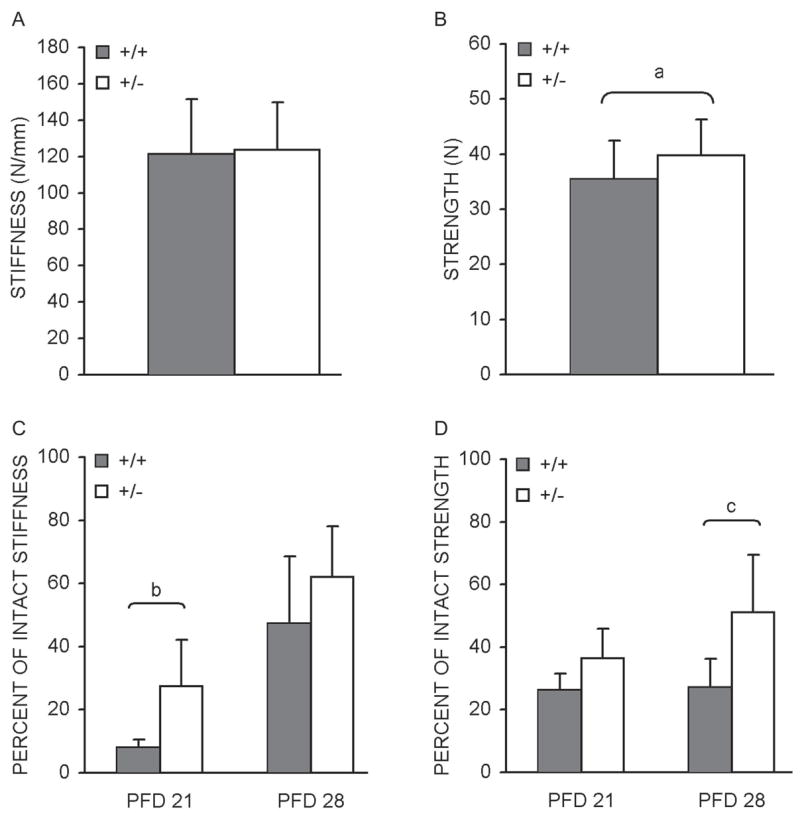
Intact and fracture callus biomechanical properties Bar graphs denoting average intact femoral (A) stiffness (N/mm) and (B) strength ± SD (N), as determined by four-point bending of samples from HIF-1α+/+ and HIF-1α+/− mice. Test results for HIF-1α+/+ and HIF-1α+/− fracture calluses were normalized to their contralateral (intact) controls and are presented as bar graphs indicating percent of intact: (C) stiffness and (D) strength ± SD. ap < 0.05, bp < 0.03, and cp < 0.01, significant difference between genotypes (Mann Whitney).