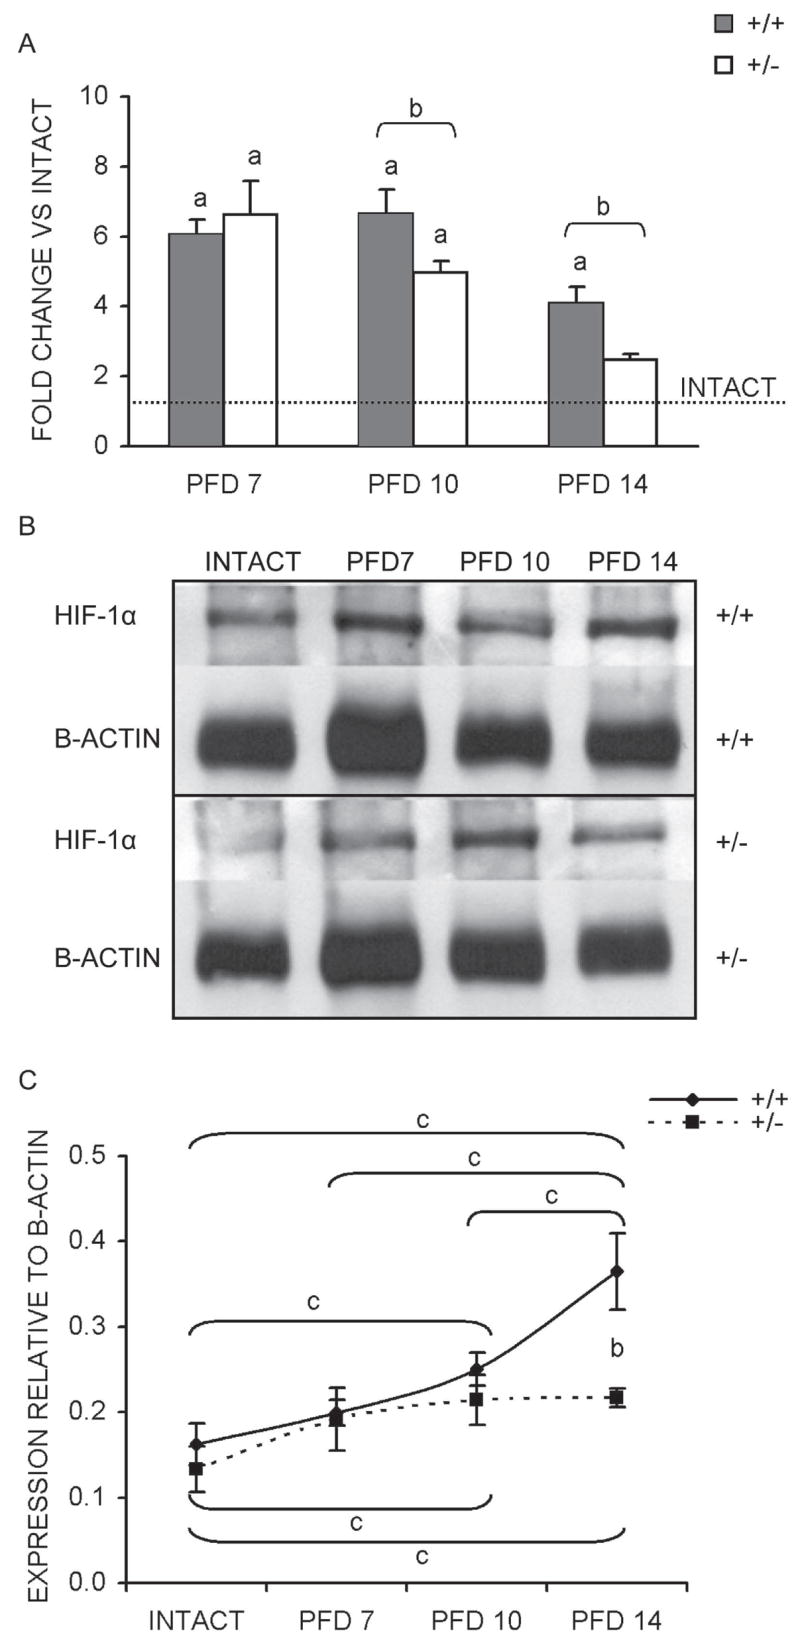
FIG. 4.

Temporal mRNA and protein expression of HIF-1α. (A) Results of qPCR determined mRNA expression levels (average of three runs ± SD) are presented as a bar graph showing fold change vs. intact bone (dashed line) for each time-point assessed. (B) Representative images of immunoblots performed to assess HIF-1α protein levels with bands corresponding to HIF-1α (120 kDa) and β-actin (42 kDa) labeled for each genotype and sample. (C) Line graph of quantified signal intensities from HIF-1α immunoblots after normalization to β-actin (average of three blots ± SD) for each time-point. ap < 0.01, significant difference between intact and callus (Mann Whitney); bp < 0.02, significant difference between genotypes (Mann Whitney); cp < 0.03, significant difference between samples within each genotype (Kruskal-Wallis with Tukey posthoc).
