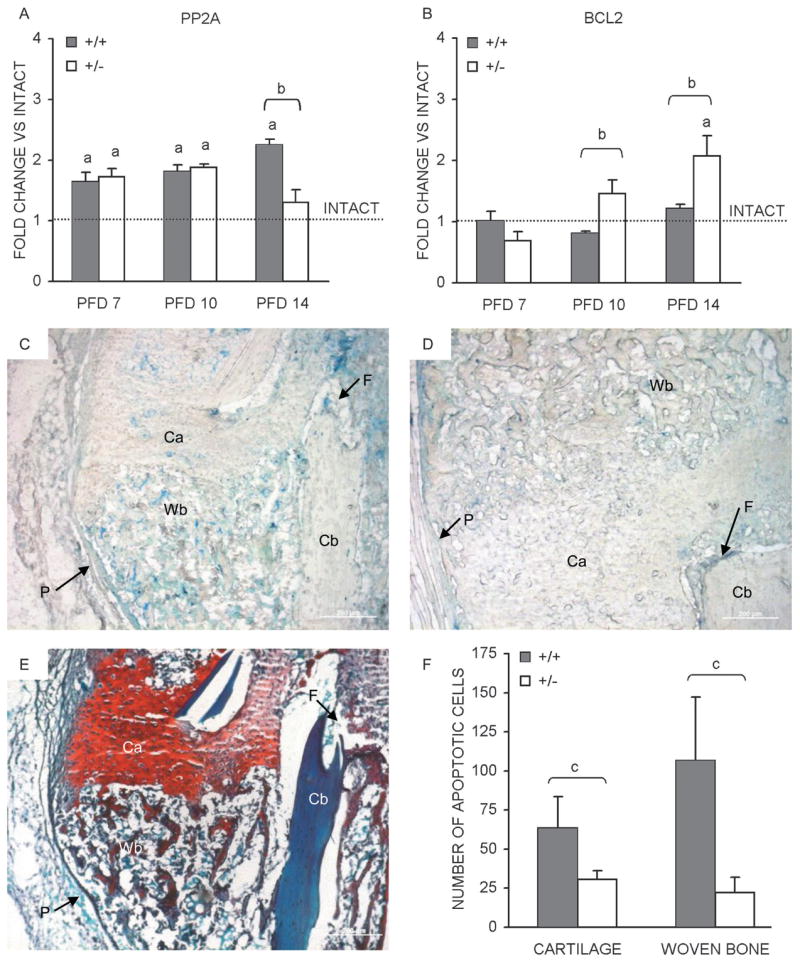
FIG. 5.

Fracture callus apoptosis. Temporal mRNA expression patterns, as determined by qPCR, for (A) PP2A and (B) BCL2, in the course of bone regeneration in HIF-1α+/+ and HIF-1α+/− mice are presented as bar graphs (average of three runs ± SD) indicating fold change vs. intact bone (dashed line). Photomicrographs of PFD 14 fracture calluses sections from (C) HIF-1α+/+ and (D) HIF-1α+/− mice after TUNEL staining was performed to identify apoptotic cells. Apoptotic cells (stained blue) are seen in regions of cartilage (Ca) and woven bone (Wb). Additionally labeled are regions of cortical bone (Cb), the fracture site (F), and periosteum (P). (E) An adjacent section stained with Safranin O/fast green to identify regions of cartilage (Ca, red) and woven bone (Wb, blue) is also presented. Scale bars represent 200 μm in all images. (F) Bar graph depicting the average number of apoptotic cells (N = 2 animals per time-point, two sections per animal) ± SD counted in regions of cartilage and woven bone from HIF-1α+/+ and HIF-1α+/− calluses. ap < 0.01, significant difference between intact and callus (Mann Whitney); bp < 0.05, significant difference between genotypes (Mann Whitney); cp < 0.03, significant difference between genotypes (Mann Whitney).
