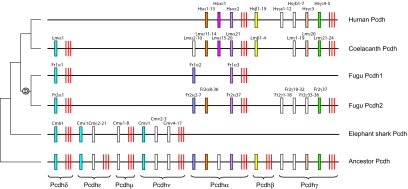
Fig. 4.
A model to explain the evolutionary history of the protocadherin cluster in jawed vertebrates. Variable exons are indicated by boxes and constant exons by red bars. Intersubcluster paralogs or orthologs between species are shown in the same color. White boxes represent protocadherin genes or paralog subgroups with no apparent intersubcluster paralogs or orthologs. Encircled “D” denotes whole-genome duplication in the ray-finned fish lineage.

