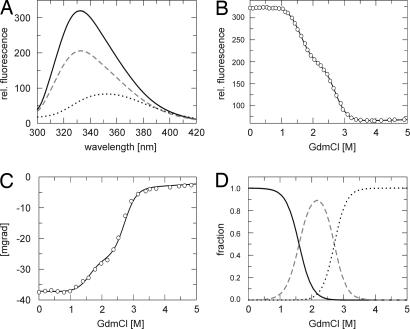
Fig. 2.
GdmCl-induced unfolding of tANK monitored by fluorescence and CD spectroscopy. (A) Fluorescence spectra of tANK at 0 M (black line), 2 M (broken gray line) and 5 M (dotted black line) GdmCl after excitation at 280 nm. GdmCl induced unfolding transitions monitored by fluorescence at 335 nm (B) and CD at 222.6 nm (C). Solid lines in B and C represent the least square fit of a three-state model (see Materials and Methods for details). (D) Calculated equilibrium populations of the native N (black line), intermediate I (broken gray line), and unfolded state U (dotted black line) according to the global analysis of fluorescence and CD equilibrium data.

