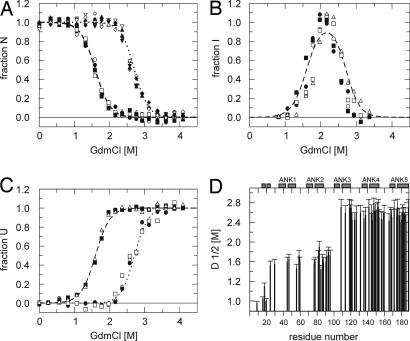
Fig. 5.
GdmCl induced unfolding transitions of tANK monitored by NMR. 15N-TROSY-HSQC spectra were recorded between 0 and 4.2 M GdmCl. (A) Normalized cross-peak volumes of backbone amides assigned to the native state at 0 M GdmCl. E45, D60, L78, G88, and V91 of AR 1–2 follow the decay of the native state population derived from the fluorescence and CD data (broken line). G109, E119, G142, L153, and A189 of AR 3–5 follow the sum of the native state and intermediate state population derived from the fluorescence and CD data (dotted lines). (B) Additional, transient cross-peaks which do not heavily overlap with peaks from the native or denatured state agree with the intermediate population (broken line) resulting from fluorescence and CD data. (C) The build-up of cross-peak volumes of the denatured state was monitored over the entire GdmCl range. Some cross-peaks are already maximal at intermediate GdmCl concentrations (2.1 M GdmCl), whereas the volumes of other cross-peaks increased with unfolding of the intermediate state. The data suggest that some residues experience a denatured like environment in the intermediate state. (D) Midpoints of denaturation profiles of 66 of 185 possible amide cross-peaks show that the two N-terminal AR are by 1 M GdmCl less stable compared with C-terminal three repeats.

