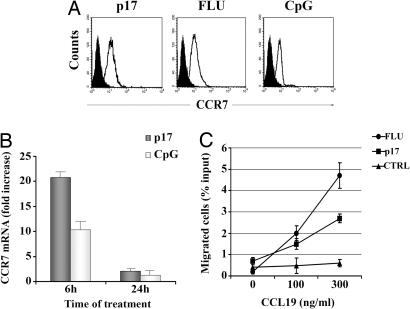
Fig. 3.
p17-treated pDCs express functional CCR7. (A) Phenotypic expression of CCR7 was analyzed on pDCs cultured for 24 h in medium (black histograms) or in the presence of the indicated stimuli (white histograms). (B) Quantitative real-time PCR analysis of CCR7 gene expression in p17- and CpG-treated pDCs. CCR7 mRNA levels are expressed as fold induction of the levels detected in untreated cells at the same time points. Bars represent the mean ± SD of triplicate samples. (C) Migration of pDCs to the indicated concentration of CCL19 was measured as described in Materials and Methods. Results are expressed as mean percentage of migration of input cells ± SD from triplicate wells. A representative experiment of five performed is shown. CTRL, control.

