Fig. 5.
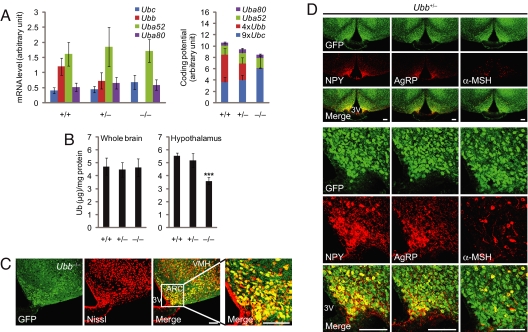
Dominant contribution of Ubb to Ub content of hypothalamus. (A) Quantification of ubiquitin transcript levels in hypothalamus of 3- to 4-month-old mice. (Left) Indicated mRNA levels, measured by quantitative real-time RT-PCR (+/+, n = 5; +/−, n = 6; −/−, n = 4). (Right) Relative contribution of ubiquitin genes to total Ub-coding potential normalized to the number of Ub moieties encoded by each ubiquitin transcript. The data are expressed as means ± SEM from the indicated number of mice. (B) Total Ub content in whole brain (n = 6 per genotype) and hypothalamus (+/+, n = 6; +/−, n = 3; −/−, n = 4) from 5- to 6-month-old mice. The data are expressed as means ± SEM from the indicated number of mice. ∗∗∗, P < 0.001 vs. Ubb+/+ mice. (C) Neuronal pattern of Ubb expression in the arcuate nucleus. Representative confocal images of GFP-Puror and Nissl stain from 4-month-old Ubb−/− mice (n = 3) are shown. The far right image shows the arcuate nucleus at higher magnification. VMH, ventromedial hypothalamus; ARC, arcuate nucleus; 3V, third ventricle. (Scale bars, 100 μm.) (D) Colocalization of NPY, AgRP, and α-MSH immunoreactive neurons in the arcuate nucleus to Ubb-expressing neurons. Representative confocal images of GFP-Puror and NPY, AgRP, and α-MSH immunoreactivity from 4-month-old Ubb+/− mice (n = 4) are shown. 3V, third ventricle. (Scale bars, 100 μm.)

