Fig. 3.
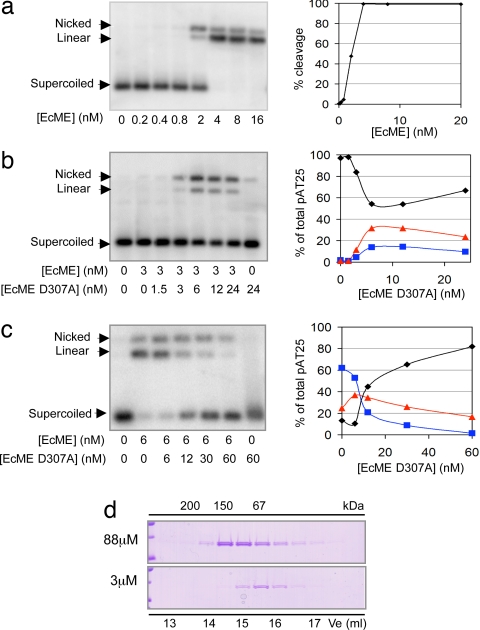
Cooperative cleavage by Mus81–Eme1. (a) Dose–response of pAT25 cleavage versus EcME concentration. pAT25 substrate [20 pM] was incubated with increasing amounts of Mus81–Eme1 as indicated. Percentage of supercoiled pAT25 substrate cleaved is plotted. Data are from one experiment and are representative of four experiments. (b) Activation of EcME by EcMED307A. pAT25 substrate [20 pM] was incubated with a fixed amount of wild-type EcME [3 nM] and increasing amounts of EcMED307A. Percentage of product and substrate present at each time point is plotted. Data are from one experiment and are representative of three experiments. The points represent supercoiled DNA (black diamonds), linear DNA (blue squares), and nicked DNA (red triangles). (c) Unilateral cleavage by mixed active/inactive EcME. pAT25 substrate [20 pM] was incubated with a fixed amount of wild-type EcME [6 nM] and increasing amounts of EcMED307A. The percentage of product and substrate present at each time point is plotted. Data are from one experiment and are representative of three experiments. (d) Gel filtration analysis of EcME. The indicated concentrations of EcME were fractionated on a Superdex S200 gel-filtration column. Aliquots of each fraction were separated by SDS/PAGE gel, and apparent molecular mass was calculated relative to standards.

