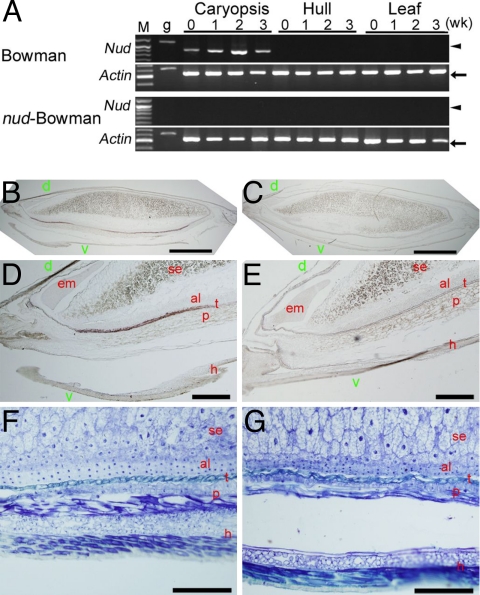
Fig. 3.
Expression patterns of Nud in the Bowman isogenic lines. (A) RT-PCR analysis of Nud expression. Lane M is a 100-bp ladder marker (arrowheads and arrows indicate 1,000 bp and 500 bp, respectively). Lane g represents amplicons using barley genomic DNA as the template. Numbers indicate weeks (wk) after anthesis. (B–E) RNA in situ hybridization with the antisense probe against longitudinal sections of 2-week-old caryopsis. (B and D) Entire caryopsis and close-up of the micropylar end of Bowman caryopsis. (C and E) Corresponding areas of nud-Bowman. (F and G) Toluidine blue O stained ventral-side caryopsis section in Bowman (F) and nud-Bowman (G). d, dorsal side; v, ventral side; em, embryo; se, starchy endosperm; al, aleurone layers; t, testa; p, pericarp; h, hull (palea). (Scale bars: B and C, 1 mm; D and E, 500 μm; F and G, 200 μm.)

