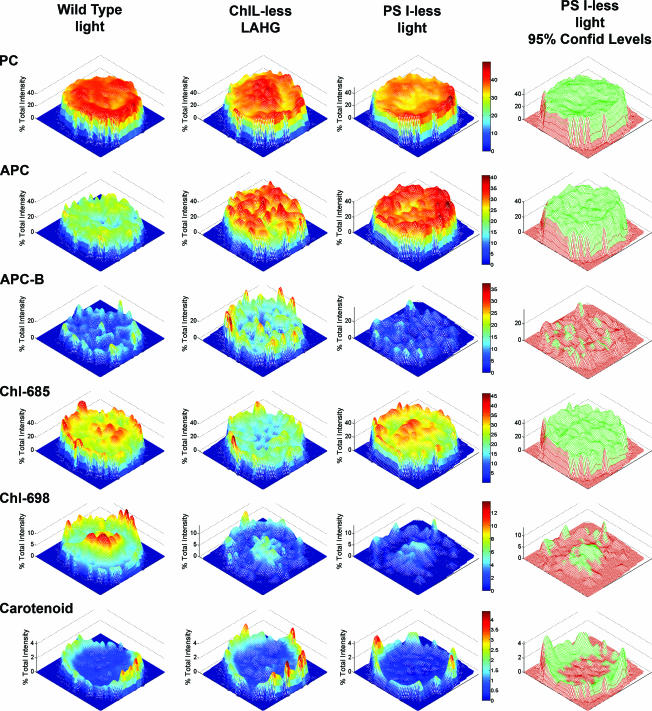
Fig. 3.
Mesh plots of percent total intensity per voxel vs. spatial distribution of the six individual components in a wild-type Synechocystis cell grown in the light (first column), a ChlL-less cell grown in LAHG conditions (second column), and a PS I-less cell grown in the light (third column). Mesh plots indicating the 95% confidence level for the PS I-less cell are in the fourth column. Voxels in green meet the 95% confidence criterion whereas voxels in red do not. Intensity values were normalized on a per-voxel basis such that the total percent intensity of all components summed to 100. x and y axis labels have been removed for simplicity. Each of the cells is ≈2 μm in diameter.

