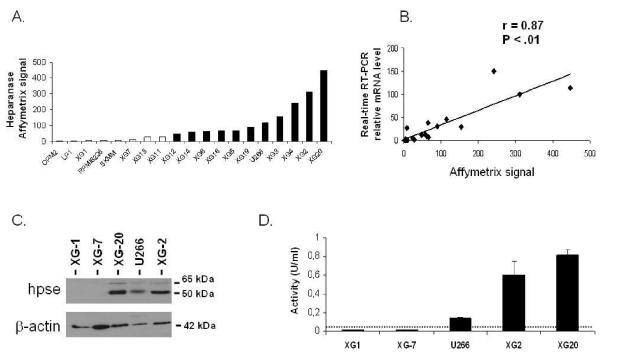
Figure 1. HPSE expression and activity are heterogeneous in HMCLs.
A. Expression of HPSE in 19 HMCLs determined using Affymetrix U133 set microarrays. White and black histograms indicate that the Affymetrix call is “absent” or “present”, respectively. B. Correlation between Affymetrix and real-time RT-PCR HPSE expression data. For real-time RT-PCR, HPSE expression in each sample was normalized to that of GAPDH and the XG-2 cell line was used as a reference with the arbitrary value of 100. C. HMCLs were lysed and the lysates were separated on a 12% SDS-PAGE and analyzed by Western blot with a polyclonal anti-HPSE antibody. Both the 65 kDa MW pro-enzyme and the 50 kDa MW active form were identified. β-actin was used as a loading control. Results are of one experiment representative of three. kDa, molecular weight in thousands. D. HPSE activity was determined using an ELISA-type detection assay. HMCLs lysates were incubated with biotinylated HS (b-HS) and then only undegraded b-HS could bind an FGF-coated ELISA plate. Bound b-HS was detected with HRP-streptavidin followed by a colorimetric assay. HPSE activity corresponding to absorbance at 450 nm was determined by comparison with a standard curve as described in “Material and Methods”. One unit is defined as the activity that can degrade 0.063 ng of b-HS when reacted at pH 5.8 at 37°C for one min. The detection limit (dotted line) was 0.05 U/ml. Results are of one experiment representative of three.

