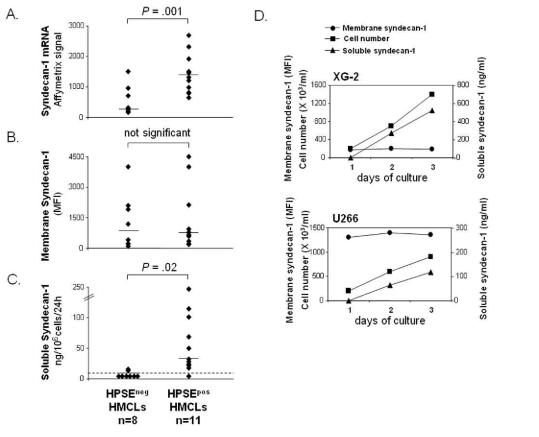
Figure 2. HMCLs that express HPSE produce higher amounts of soluble syndecan-1.
A. Syndecan-1 expression was determined in the 19 HMCLs using Affymetrix U133 set microarrays. B. Mean fluorescence intensity of membrane syndecan-1 expression determined with a PE-conjugated anti-GDI38 MoAb, a PE-isotype-matched control MoAb, and FACS analysis. For each cell line, the mean fluorescence intensity obtained with the control MoAb was set between 4–6. C. For the 19 HMCLs, the rates of production of soluble syndecan-1 per 106 cells and per 24 h was determined during the 2nd and 3rd days of culture (exponential growth phase) and measured by ELISA. The dotted line indicates the detection limit of the test (<8 ng/mL). D. For XG-2 and U266 HMCLs, the cell count, the density of membrane syndecan-1 and the concentration of soluble syndecan-1 in the culture supernatant were determined each day for three days.

