
Figure 5.
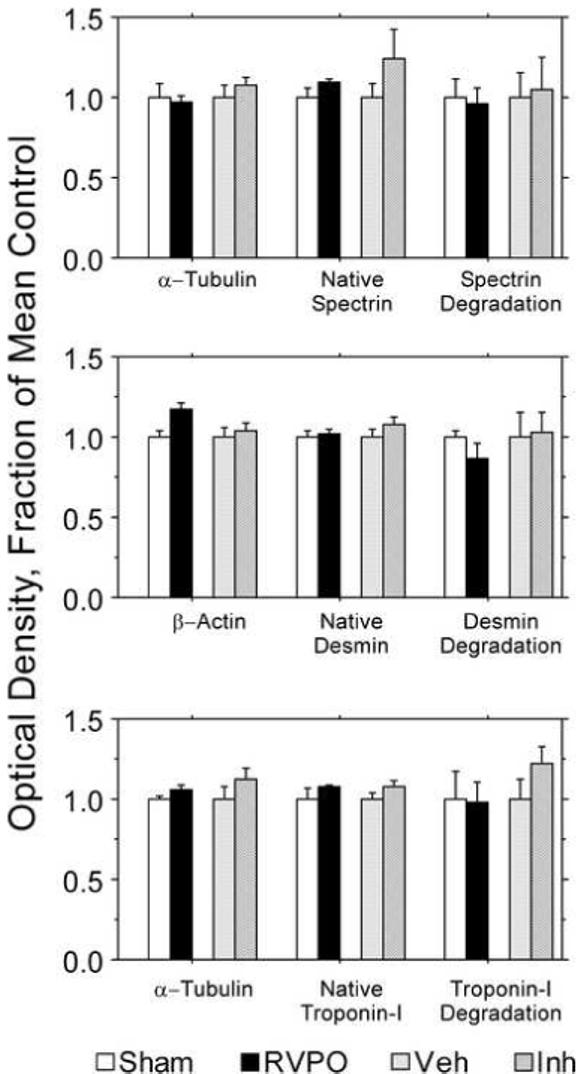
Densitometric analysis of the Western immunoblots shown in Figure 5 (see Figure 5 for description of immunoblots). There were no significant differences between groups for absolute values of degradation products, ratio of degradation products to native protein, or native protein normalized to the loading controls.