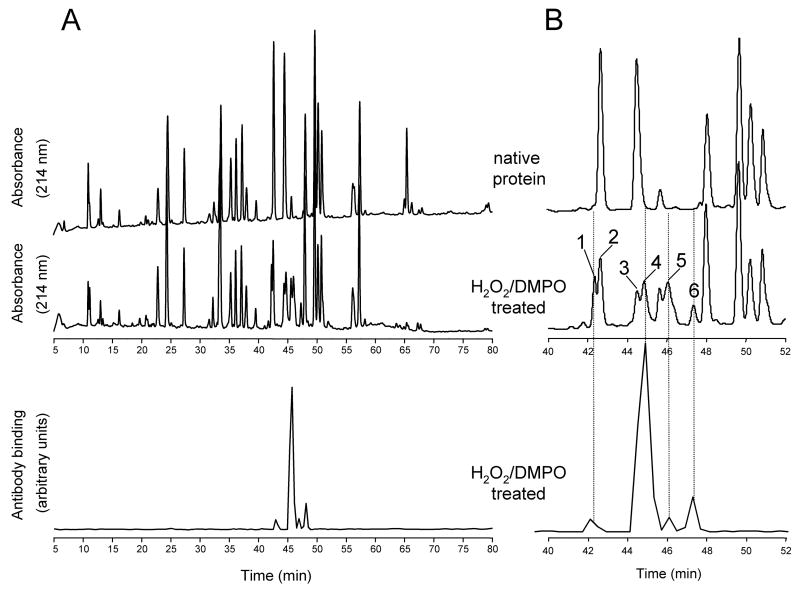
Figure 4.
Comparison of peptide maps of human hemoglobin. (A), reversed-phase HPLC of the tryptic peptides derived from intact native Hb and from Hb reacted with H2O2 in the presence of DMPO; (B), expanded view of panel A. Absorbance was monitored at 214 nm. Fractions were collected every 0.4 min in Eppendorf tubes containing excess NH4HCO3, and an aliquot of each fraction was analyzed by ELISA. The fractions showing a strong positive ELISA signal or corresponding to chromatographic peaks showing marked decreases in intensity relative to controls were further characterized by tandem mass spectrometry. Peak assignment and mass analysis are summarized in Table 1.

