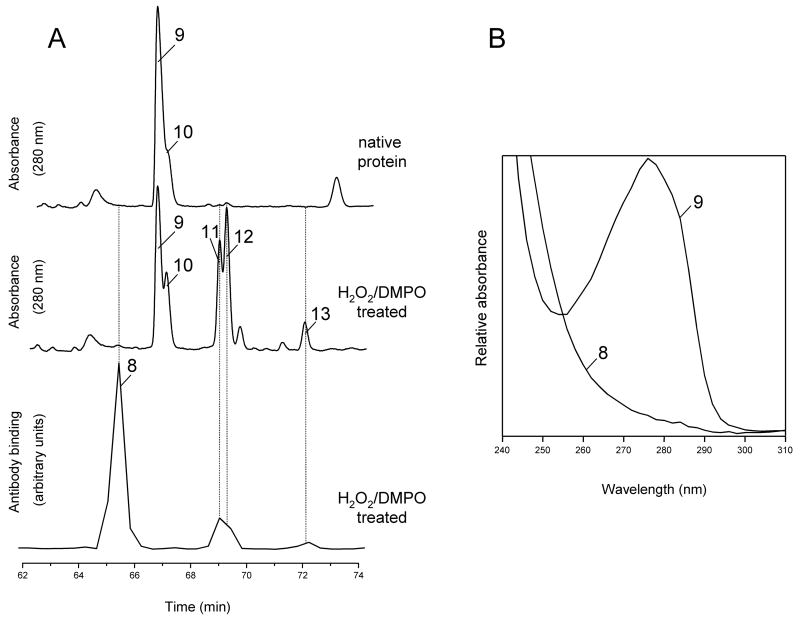
Figure 9.
Tryptic maps and absorbance spectra from intact horse heart Mb and from Mb reacted with H2O2 in the presence of DMPO. (A), HPLC tryptic maps monitored at 280 nm. Fractions were collected every 0.4 min in Eppendorf tubes containing excess NH4HCO3, and an aliquot of each fraction was analyzed by ELISA. Chromatograms show only the time window in which some peptides exhibiting a strong positive ELISA signal eluted. Peak assignment and mass analysis are summarized in Table 1. (B), absorbance spectra recorded by the diode-array detector in the eluent of the HPLC system. The spectra are scaled arbitrarily.

