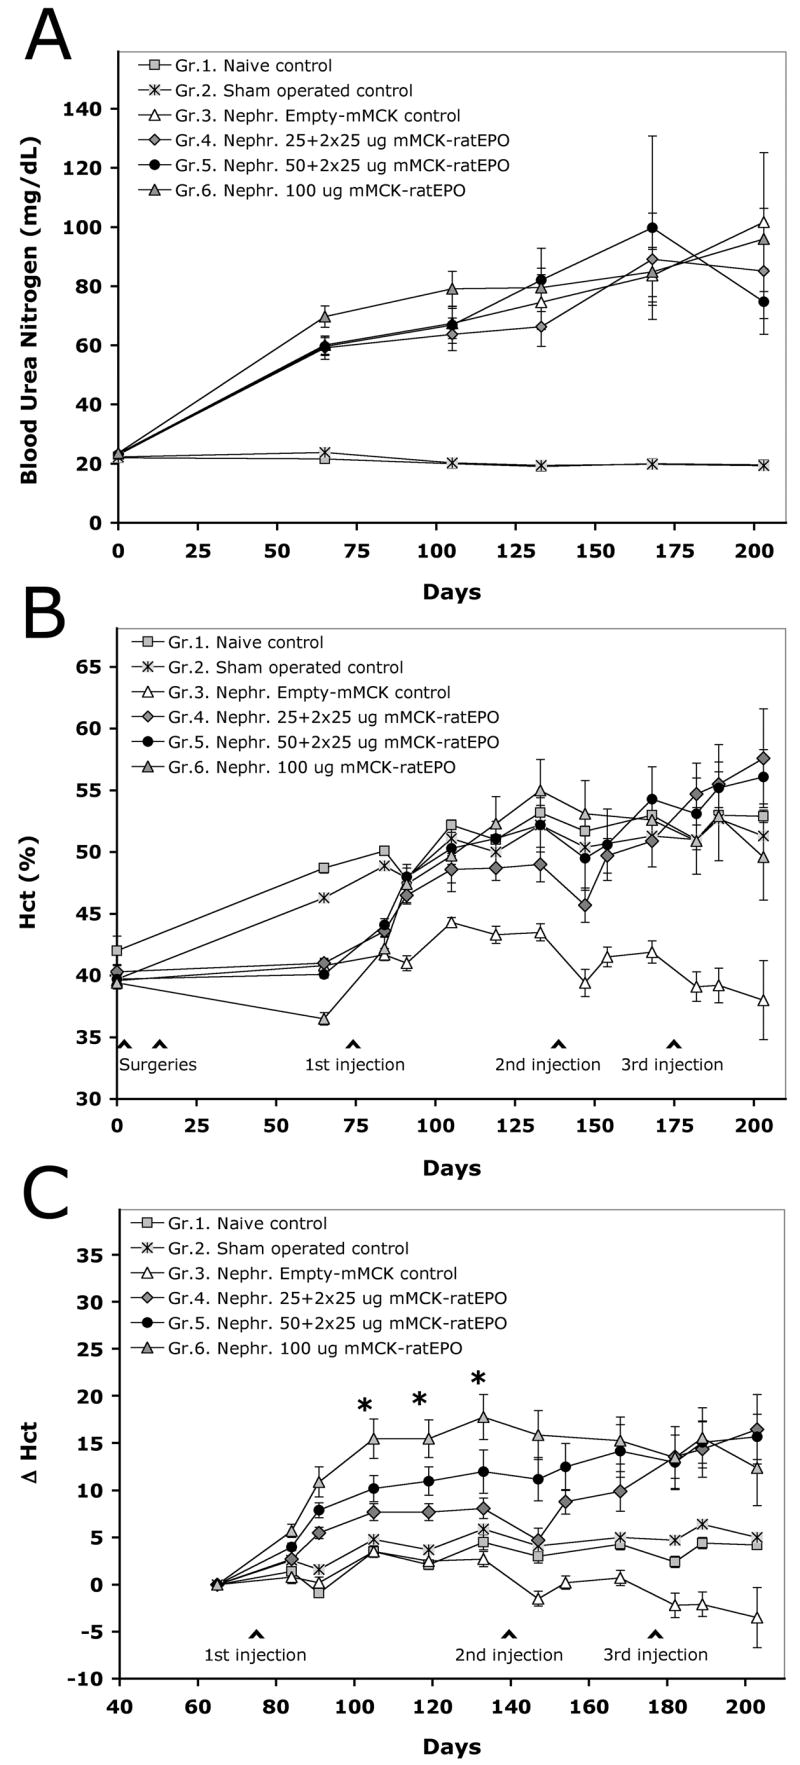
Figure 3. Correction of anemia in a rat disease model by the repeated, small-dose injections of mMCK-ratEPO.

The anemia model was created by 5/6 nephrectomy, followed by the HLV delivery of either an empty control vector (Group 3), or the EPO-expressing mMCK-ratEPO pDNA (Groups 4–6). The naïve (Group 1) and sham-operated (Group 2) controls did not receive any pDNA. A. Blood urea nitrogen values (mg/dL). B. Hematocrit values (%). C. Each individual animals’ pre-injection baseline hematocrit was subtracted from their hematocrit value at any later time point to plot the absolute change in their hematocrit (Δ Hct) resulted by gene delivery. Group averages and SEM values are shown. Initial number of animals in the groups: Gr.1. n=7; Gr.2. n=10; Gr.3, 4 and 5 n=11; Gr.6. n=12. The asterisks mark a 4-week period between days 105–133, when Δ Hct values in all three EPO-injected groups were significantly different from the control groups (at least p<0.05) and when Gr.4. and Gr.5. were also significantly different from Gr.6. (p<0.05). While all three EPO-treated groups remained significantly different from the controls for the rest of the study, differences between the three EPO-injected groups diminished after delivering additional mMCK-ratEPO doses.
