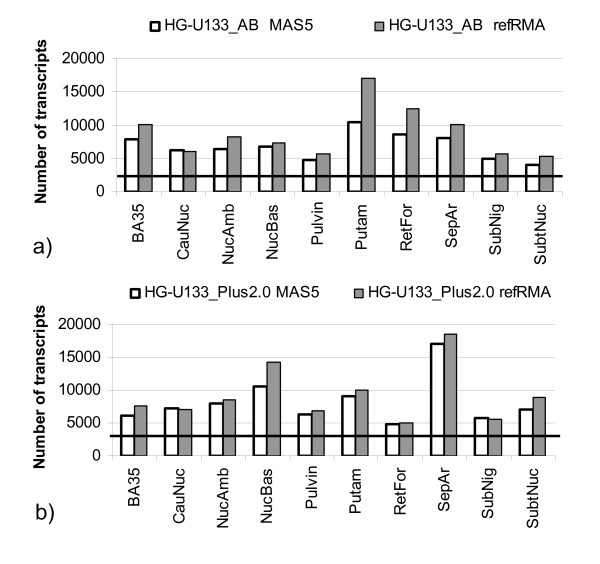
Figure 3.
Number of significant correlations to beta actin ratio within chip set. Number of transcripts that show significant (<0.05) correlation to beta actin ratio in all considered sample sets for two chip platforms and two normalizations: a) HG-U133_plus2.0 chip, b) HG-U133_AB chip. Horizontal line indicates a number of significant hits expected by chance. They are: 5% of 54613 ≅ 2731 for HG-U133_Plus2.0 chip and 5% of 44792 ≅ 2240 for HG-U133_AB chip.

