
Figure 3.
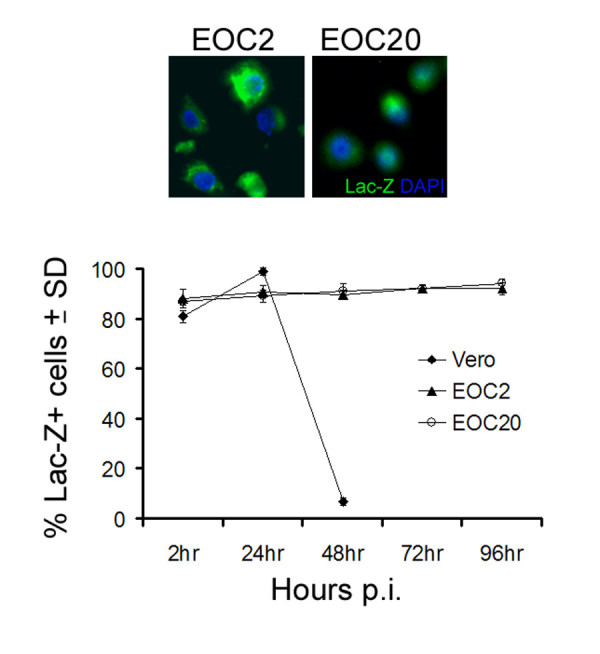
ΔRR infected cells express ICP10PK. (A) EOC2 and EOC20 cells infected with ΔRR (moi = 5) were stained with the LacZ substrate C12FDG at 24 hrs p.i. to visualize ICP10PK expression (Lac-Z). (B) EOC2, EOC20 and Vero cells were stained with C12FDG and the % staining cells at 4–96 hrs p.i. was determined by counting 5 randomly selected fields, (at least 250 cells each, in a 3 mm2 area). Results are expressed as % positive cells/total number of cells determined by DAPI staining. The mean % ICP10PK (Lac-Z) ± SD are shown.