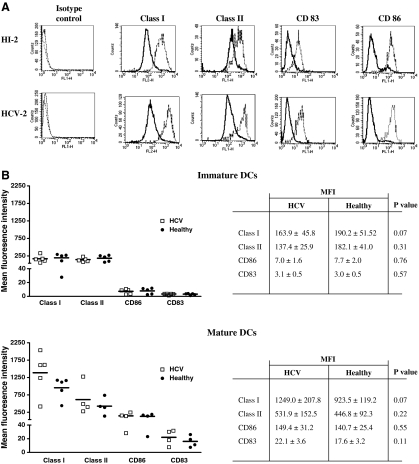
Fig. 1.
The phenotypic characteristics of immature and mature DCs in HCV infected and healthy individuals. The expression (mean fluorescence intensity–MFI) of HLA class I, HLA class II, CD 86 and CD83 on immature (bold line) and dsRNA matured (dotted line) MD-DCs from a representative HCV infected individual (HCV-2) and a healthy control individual is shown (HI-2) (A). The expression of these markers on MD-DCs is compared between healthy and HCV infected individuals on both immature (B, upper panel) and mature (B, lower panel) MD-DCs. The table inserts give the MFI ± standard error and P values for each marker.

