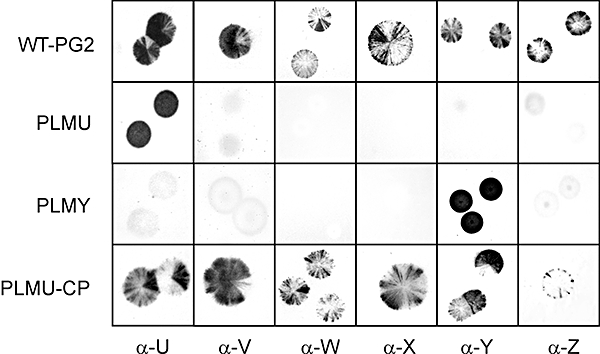
Fig. 2.

Colony immunoblot analysis of M. agalactiae type strain PG2 and its derivative mutants using the six Vpma-specific pAbs recognizing specific surface exposed epitopes. PLMU and PLMY represent the two xer1-disrupted PLMs expressing exclusively VpmaU and VpmaY respectively. WT-PG2 and PLMU-CP representing the xer1-complemented PLMU show sectorial staining phenotype with all Vpma-specific pAbs reflecting high frequency Vpma phase variations. Designations of Vpma-specific pAbs as used for each column, and as described in Table 1, are indicated at the bottom.
