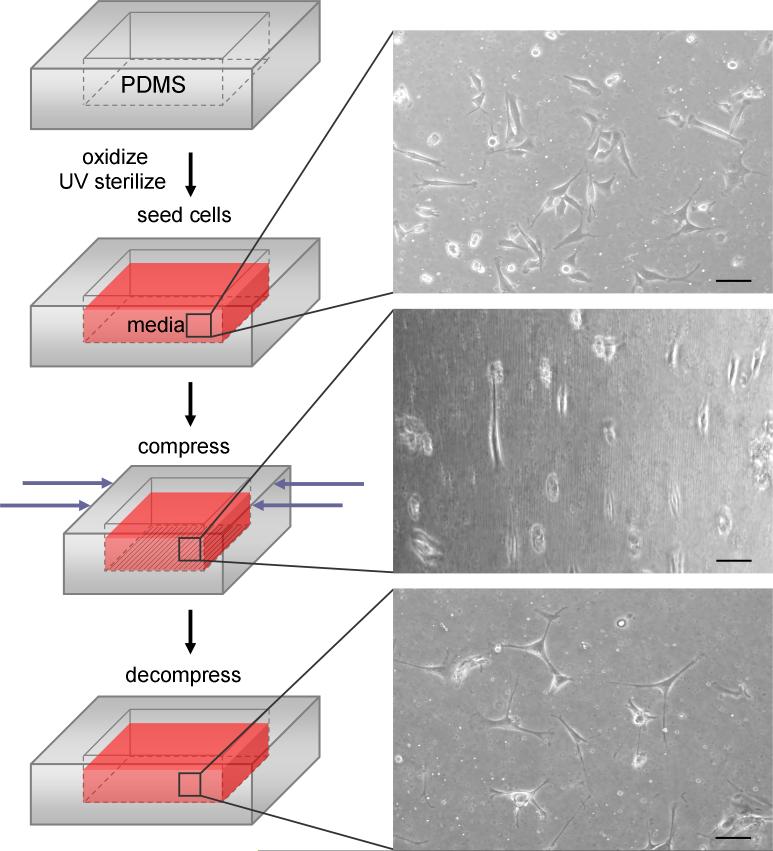
Fig. 4.
(a) Optical microscopy images of muscle cells on the reversible wavy surfaces; cell aligned along the waves and returned to random orientation on the uncompressed, flat surface within 24 h. Scale bars = 50 μm. (b) Average orientation angles for cells during repeated compression (wavy) and uncompression (flat), and (c) corresponding cell images (scale bars = 100 μm); some images are slightly blurred due to imaging during compression through a curved surface. In (b), upper, red dashed line indicates the angle for random orientation (45°); cells on flat surfaces exhibited angles close to random; lower, purple dashed line indicates average angle for cells over all compressed time points (8° ± 7°). 21 h n = 153, 48 h n = 283, 73 h n = 188, 97 h n = 208, 128 h n = 125, 150 h n = 149, 169 h n = 109, 192 h n = 150, 216 h n = 83. Bars represent standard deviation; * denotes statistical significance.

