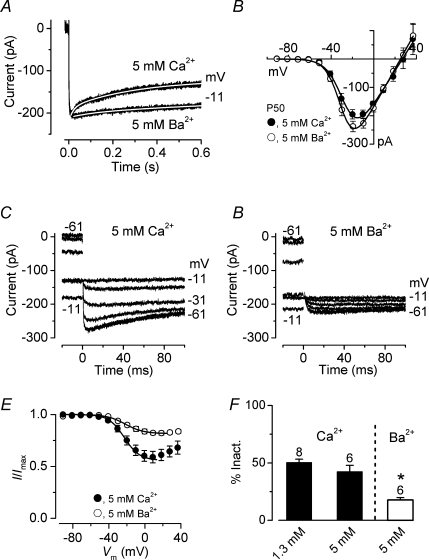
Figure 5. Ca2+ channel inactivation is reduced by barium.
A, inward currents recorded during the superfusion of 5 mm Ca2+ or 5 mm Ba2+ from a P50 apical IHC in response to a 600 ms voltage step to −11 mV from a holding potential of −81 mV. Fits through the data were obtained using a double exponential equation. The fitting parameters are: 5 mm Ca2+τfast 19 ms, τslow 299 ms; 5 mm Ba2+τfast 86 ms, τslow 855 ms. Cell properties were: Cm 11.9 pF, Rs 6.3 MΩ, gleak 1.7 nS. B, average I–V curves of peak inward currents in 5 mm Ca2+ or 5 mm Ba2+ from the same 6 IHCs (2 apical and 4 basal IHCs, P50). Continuous lines are fits using eqn (1). Fitting parameters are: 5 mm Ca2+gmax 6.0 nS, Vrev 27 mV, V½−26.8 mV, S 7.6 mV; 5 mm Ba2+gmax 6.8 nS, Vrev 25 mV, V½−29.2 mV, S 6.8 mV. C and D, inward tail currents recorded at a membrane potential of −11 mV after a series of depolarizing conditioning steps (600 ms) from −91 mV (see protocol in Fig. 4A–C). Residual capacitative transients have been blanked. Recordings in C and D are from the same IHC shown in A. E, average inactivation curves obtained by plotting the peak inward tail currents described in panels C and D (in 5 mm Ca2+ and 5 mm Ba2+). The continuous lines are fits up to the potential of maximum inactivation using eqn (3). Fitting parameters are: 5 mm Ca2+Imax=−274 pA, Iconst= 0.57, V½=−23.3 mV, S = 9.3 mV; 5 mm Ba2+Imax=−249 pA, Iconst= 0.81, V½=−21.7 mV, S = 10.1 mV. F, average percentage of current inactivation obtained from fitting individual inactivation curves using eqn (3). For comparisons, the value obtained in 1.3 mm Ca2+ (from Fig. 4F) is also shown. Number of cells is shown above the columns.

