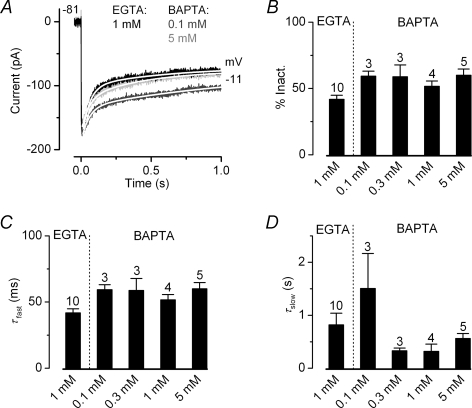
Figure 6. Ca2+ buffers do not prevent inactivation of the Ca2+ channels.
A, Ca2+ currents recorded from adult basal IHCs in the presence of 1 mm EGTA (black), 0.1 mm BAPTA (dark grey) or 5 mm BAPTA (grey) in response to a 1 s voltage step to −11 mV from a holding potential of −81 mV. Fits through the data were obtained using a double exponential equation. The fitting parameters are: 1 mm EGTA τfast 52 ms, τslow 435 ms; 0.1 mm BAPTA τfast 54 ms, τslow 1181 ms, 5 mm BAPTA τfast 51 ms, τslow 589 ms. Cell properties were: 1 mm EGTA (P25) Cm 12.2 pF, Rs 4.7 MΩ, gleak 0.8 nS; 0.1 mm BAPTA (P69) Cm 10.5 pF, Rs 5.4 MΩ, gleak 0.9 nS; 5 mm BAPTA (P69) Cm 10.4 pF, Rs 4.2 MΩ, gleak 0.6 nS. B, Average percentage of ICa inactivation using 1 mm EGTA (P25 basal IHCs) and different BAPTA (0.1, 0.3, 1 and 5 mm) concentrations (P69 basal IHCs). C and D, fast (τfast) and slow (τslow) time constants obtained by fitting the time course of ICa inactivation using a double exponential. Number of cells in B–D is shown above each column.

