
Figure 1.
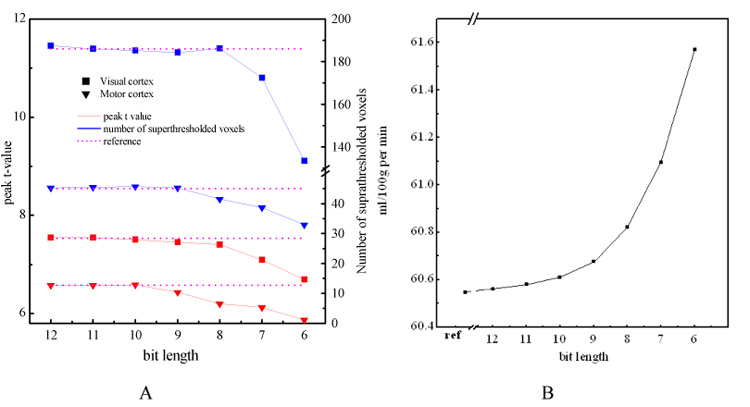
Bit resolution simulation results. A) the peak t values (red lines) and the suprathresholded (P < 0.001) cluster size (blue lines) within the visual cortex (solid squares) and the motor cortex (solid triangles) averaged on 4 subjects for each bit resolution, B) averaged global CBF value calculated at each bit resolution. In A) the left vertical axis is for peak t-value, the right vertical axis is for cluster size, the purple lines are the reference lines indicating corresponding values calculated from the floating point data which are reconstructed from the k-space data. In B) "ref" means reference CBF value calculated from the floating point data