
Figure 2.
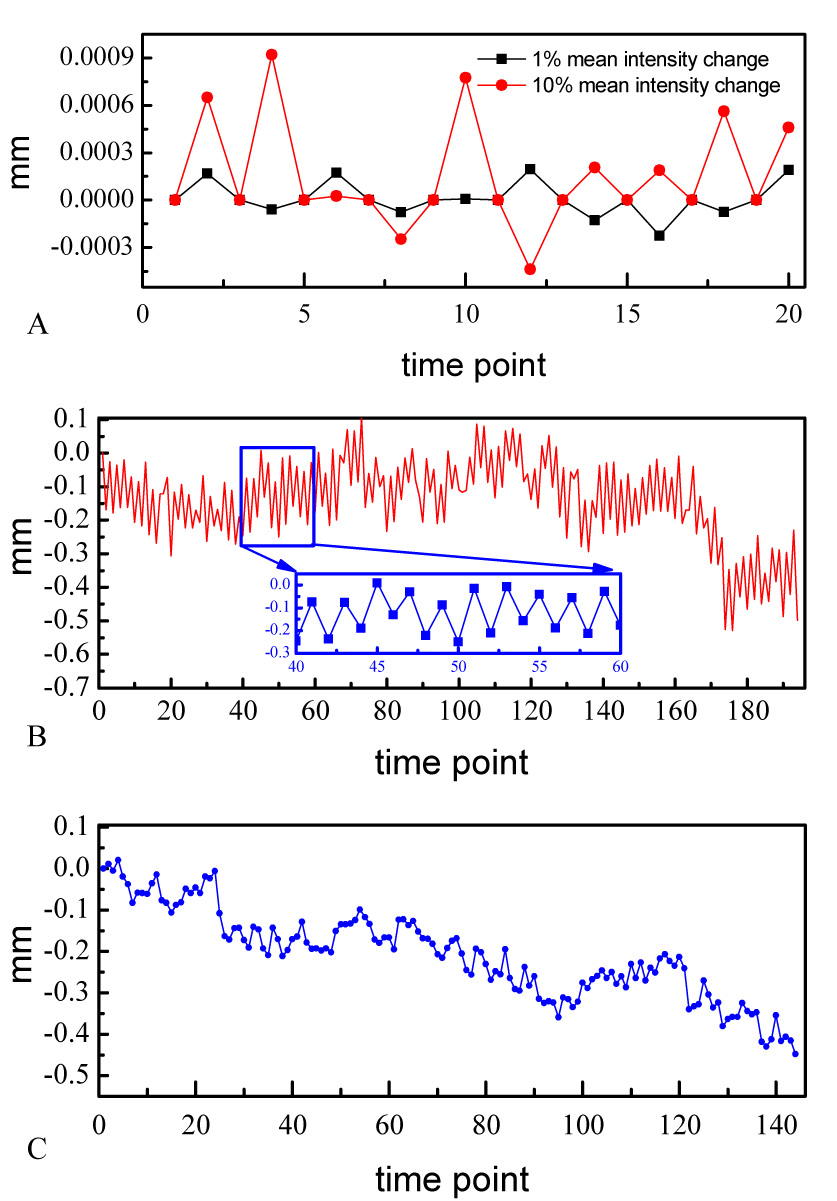
Estimated head motions along z direction for A) the synthetic data with 1% and 10% mean intensity changes, B) pCASL with background suppression data, and C) one representative subject’s sensorimotor CASL fMRI data. The inset of B is a zoom version of the motion time course from 40 to 60 TRs.